Animation Caption: Sea Surface Height Anomaly (SSHA) from -30 cm (blue) to 30 cm (red) over the global ocean, arrows on top represent the ocean currents. The circular shapes of those anomalies are mesoscale eddies. The panels present a side-by-side comparison between the NeurOST method and the conventional method widely used. First, the SSHA, then the derived ocean current speed and finally the vorticity are shown to illustrate NeurOST’s capability to retrieve fine details of the ocean eddies. Mesoscale eddies, circular currents of water with diameters spanning from 50 to 300 kilometers, transport freshwater, heat, carbon, nutrients, etc. around the world and within the ocean, profoundly impacting marine ecosystems and the Earth's climate. They also account for over 80% of the ocean’s kinetic energy, the energy created by the movement of ocean water. Mesoscale eddies are therefore critical components of the global ocean circulation and climate, and need to be better characterized and understood.Satellite altimetry measuring Sea Surface Height (SSH), from which ocean currents can be deduced, has been a valuable tool in tracking these ocean mesoscale eddies over the past three decades1. However, tracking eddies from SSH observations poses significant challenges due to the limitations of conventional nadir altimeters, such as Sentinel-6 Michael Freilich. These instruments measure sea level along the nadir track, which leaves large gaps between tracks. Therefore, it is necessary to interpolate these observations using an a-priori estimation of the relationship between different measurements in space and in time. This results in global grids of SSH with spatial and temporal resolutions of ~100km and 10 days, respectively, which limits the two-dimensional eddy reconstruction and tracking. Researchers are starting to leverage the recent advancement of machine learning to overcome those limitations. The recently published SSH gridded product, NeurOST, on PO.DAAC is a notable example.The novel method combines Sea Surface Temperature anomaly (SSTA) and along-track nadir altimeter SSH anomaly (SSHA) data to create a new daily higher resolution SSHA and ocean current dataset2. This artificial intelligence (AI) method called deep learning teaches computers to recognize patterns and connections in space and time in a combination of data, here SSHA and SSTA. The resulting animation above, spanning from January 2018 to December 2023, displays NeurOST SSHA estimates with ocean currents on top as arrows. The height of the sea surface has highs (red) and lows (blue) indicating ocean eddies and currents. The animation then zooms in a very energetic area in the western Pacific Ocean and shows some comparisons between this new artificial intelligence method and the observations from conventional gridded altimetry products (Data Unification and Altimeter Combination System; DUACS). First, the SSHA are displayed, then the ocean current speed computed from both products and finally, the vorticity, that represents the rotation of the ocean water mass. We can see the improved ability of this new AI product to capture features such as ocean eddies. This suggests that AI methods such as deep learning can be powerful tools to study our oceans.The machine learning methodology and data product were developed by an Ocean Surface Topography Science Team at the University of Washington and sponsored by NASA Physical Oceanography program (PO). The method was published in two publications2,3 and welcomes further investigations. The project is emerging as an essential component of the newly established NASA Ocean AI Working Group, an important step forward by NASA PO teams to advance modern satellite data synthesis. By leveraging cutting-edge machine learning techniques, researchers can explore how to effectively process and analyze vast amounts of satellite data to enhance understanding of the Earth's oceans and ultimately improve climate predictions.
via PO.DAAC https://podaac.jpl.nasa.gov/DataAction-2024…
via PO.DAAC https://podaac.jpl.nasa.gov/DataAction-2024…
NASA Jet Propulsion Laboratory (JPL)
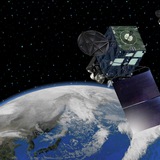
Sentinel-6 Michael Freilich Satellite
Designed to measure the height of the ocean - a key component to understanding how Earth's climate is changing - Sentinel-6/Michael Freilich consists of two identical satellites that will be launched five years apart.
Pyrocumulonimbus cloud in southeast Australia
via Himawari-9 – CIMSS Satellite Blog (author: Scott Bachmeier)
via Himawari-9 – CIMSS Satellite Blog (author: Scott Bachmeier)
Telegraph
Pyrocumulonimbus cloud in southeast Australia
JMA Himawari-9 “Red” Visible (0.64 µm, top), Shortwave Infrared (3.9 µm, center) and “Clean” Infrared Window (10.4 µm, bottom) images, with hourly plots of surface reports [click to play animated GIF | MP4]
#Typhoon #Pabuk
https://www.ssd.noaa.gov/PS/TROP/floaters/28W/imagery/vis_lalo-animated.gif Note: NOAA is keeping this gif animation up to date but the gif preview provided by Telegram does not evolve with time, thus click the url to watch the auto-updated gif please.
https://www.ssd.noaa.gov/PS/TROP/floaters/28W/imagery/vis_lalo-animated.gif Note: NOAA is keeping this gif animation up to date but the gif preview provided by Telegram does not evolve with time, thus click the url to watch the auto-updated gif please.
Significant Flooding in Northeast Australia
via Himawari-9 – CIMSS Satellite Blog (author: Tim Wagner)
via Himawari-9 – CIMSS Satellite Blog (author: Tim Wagner)
Telegraph
Significant Flooding in Northeast Australia
The past few days have brought devastating rain and flooding to the Australian state of Queensland, in the country’s northeast. The community of Paluma received more than 1.4 meters (4.5 feet) of rain over the weekend, and damage to roads and bridges carried…
Grampians bushfire in southeast Australia produces a pyrocumulonimbus cloud
via Himawari-9 – CIMSS Satellite Blog (author: Scott Bachmeier)
via Himawari-9 – CIMSS Satellite Blog (author: Scott Bachmeier)
Telegraph
Grampians bushfire in southeast Australia produces a pyrocum…
JMA Himawari-9 “Red” Visible (0.64 µm, top), Shortwave Infrared (3.9 µm, center) and “Clean” Infrared Window (10.4 µm, bottom) images from 0300-0510 UTC on 4th February, with plots of surface reports [click to play animated GIF | MP4]
Severe Tropical Cyclone Zelia Hits Australia
via Himawari-9 – CIMSS Satellite Blog (author: Tim Wagner)
via Himawari-9 – CIMSS Satellite Blog (author: Tim Wagner)
Telegraph
Severe Tropical Cyclone Zelia Hits Australia
Overnight in the eastern Indian ocean, a tropical storm underwent significant deepening to become Severe Tropical Cyclone Zelia. The name “tropical cyclone” might make one think of a comparatively weak storm compared to a hurricane, but that is because the…
High winds prevent a Hawaiian Airlines flight to Pago Pago from landing
via Himawari-9 – CIMSS Satellite Blog (author: Scott Lindstrom)
via Himawari-9 – CIMSS Satellite Blog (author: Scott Lindstrom)
Telegraph
High winds prevent a Hawaiian Airlines flight to Pago Pago f…
On 20 February 2025, high winds at Pago Pago International Airport (located at 14.3oS, 170.7oW) meant Hawaiian Airlines Flight 465 (an A330 with 160 passengers on board) was forced to return to Honolulu (News Article) without its scheduled landing in Pago…
Fast-moving wildfires produce pyrocumulonimbus clouds over South Korea
via Himawari-9 – CIMSS Satellite Blog (author: Scott Bachmeier)
via Himawari-9 – CIMSS Satellite Blog (author: Scott Bachmeier)
Telegraph
Fast-moving wildfires produce pyrocumulonimbus clouds over S…
2.5 minute JMA Himawari-9 “Red” Visible (0.64 µm, top), Shortwave Infrared (3.9 µm, center) and “Clean” Infrared Window (10.4 µm, bottom) images from 0200-1047 UTC on 25 March [click to play animated GIF | MP4]
When you have an isolated thunderstorm, how can you tell that it’s not a volcanic eruption?
via Himawari-9 – CIMSS Satellite Blog (author: Scott Lindstrom)
via Himawari-9 – CIMSS Satellite Blog (author: Scott Lindstrom)
Telegraph
When you have an isolated thunderstorm, how can you tell tha…
Brandon Aydlett, the Science and Operations Officer (SOO) at the NWS forecast office in Guam (where the National Weather Service day begins) relays the following message: Yesterday we received a call from a local radio noting something suspicious in IR imagery…
Direct Broadcast views of strong convection in the western Pacific Ocean
via Himawari-9 – CIMSS Satellite Blog (author: Scott Lindstrom)
via Himawari-9 – CIMSS Satellite Blog (author: Scott Lindstrom)
Telegraph
Direct Broadcast views of strong convection in the western P…
Himawari-9 clean window (Band 13, 10.4 µm) infrared imagery, below, shows strong convection developing in the Philippine Sea between the Philippines to the west, Japan to the north, and Guam far to the east. The structure of the the convection in the infrared…
Cyclone Errol rapidly intensifies to Category 5 intensity off the coast of Western Australia
via Himawari-9 – CIMSS Satellite Blog (author: Scott Bachmeier)
via Himawari-9 – CIMSS Satellite Blog (author: Scott Bachmeier)
Telegraph
Cyclone Errol rapidly intensifies to Category 5 intensity of…
2.5-minute JMA Himawari-9 Red Visible (0.64 µm, left) and Clean Infrared Window (10.4 µm, right) images, from 2302 UTC on 15 April to 0942 UTC on 16 April [click to play animated GIF | MP4]
Atmospheric spectra in the west Pacific
via Himawari-9 – CIMSS Satellite Blog (author: Scott Lindstrom)
via Himawari-9 – CIMSS Satellite Blog (author: Scott Lindstrom)
Telegraph
Atmospheric spectra in the west Pacific
When Himawari-10 launches (currently scheduled for late 2028/early 2029), it will carry the GHMS, the Geostationary HiMawari Sounder, planned to give hourly sounder imagery (with more frequent observations — about 4 per hour — in smaller targetable domains…
Eruption of Lewotobi in Indonesia
Himawari-9 Ash Height product [click to play MP4 animation]
The Lewotobi Laki-laki volcano in Indonesia erupted shortly before 0940 UTC on 17 June 2025 — and the radiometrically-retrieved Ash Height product from the NOAA/CIMSS Volcanic Cloud Monitoring site (above) indicated that ash reached altitudes of 16-18 km.
The corresponding Ash Click Me Load More product (below) showed that there were initially high levels of ash loading, which then decreased as the volcanic cloud expanded across the region.
Himawari-9 Ash Click Me Load More product [click to play MP4 animation]
Himawari-9 Ash RGB images created using Geo2Grid(below) revealed that the volcanic cloud was composed of either primarily ash (shades of red), a mixture of ash and SO2 (shades of yellow) or primarily SO2 (shades of cyan).
Himawari-9 Ash RGB images [click to play animated GIF | MP4]
via Himawari-9 – CIMSS Satellite Blog (author: Scott Bachmeier)
Invalid media:
video
video
Satellite Observations (Asia-Pacific)
Eruption of Lewotobi in Indonesia Himawari-9 Ash Height product [click to play MP4 animation] The Lewotobi Laki-laki volcano in Indonesia erupted shortly before 0940 UTC on 17 June 2025 — and the radiometrically-retrieved Ash Height product from the NOAA/CIMSS…
This media is not supported in your browser
VIEW IN TELEGRAM
Active Monsoon trough over the western Pacific
via Himawari-9 – CIMSS Satellite Blog (author: Scott Lindstrom)
via Himawari-9 – CIMSS Satellite Blog (author: Scott Lindstrom)
Telegraph
Active Monsoon trough over the western Pacific
Total Precipitable Water (TPW) fields across the western Pacific (source), show a band of abundant moisture between 10o and 20o N latitude. In addition, the remnants of Sepat are moving to the north and east of Japan, and a tropical depression is making landfall…